Quincy WA Real Estate For Seattle Area Buyers
April 16, 2026
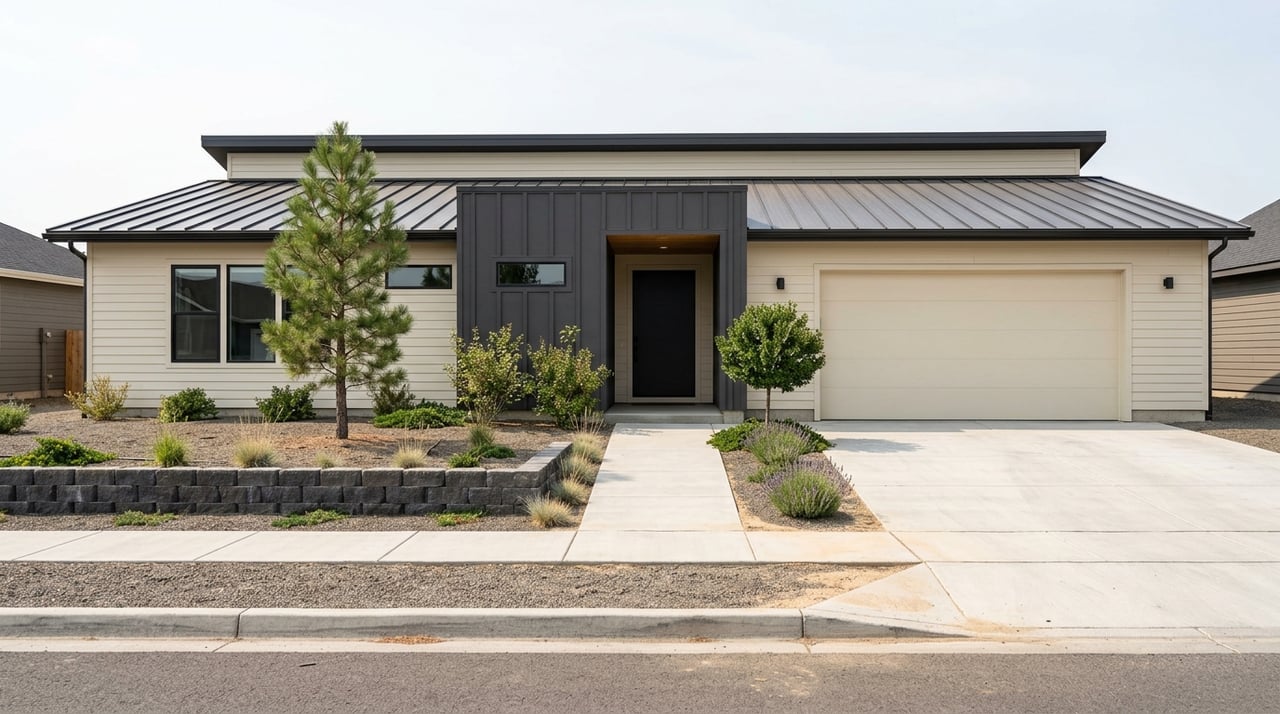
April 16, 2026
Thinking about trading Seattle or Eastside housing costs for more space and a lower price point? If Quincy has started showing up on your radar, you are not alone. For many Seattle-area buyers, Quincy offers a very different cost picture, a slower market pace, and a chance to buy with less pressure. Let’s break down what the numbers actually say so you can decide whether a Quincy purchase makes sense for your goals.
If you are shopping from Seattle, Bellevue, or the Eastside, the first thing you will likely notice is the price gap. According to Realtor.com’s Quincy housing market data, Quincy has a median listing price of $436,750. That compares with $765,000 in Seattle and $1,499,975 in Bellevue.
That difference changes the conversation quickly. Quincy’s median listing price is about 57% of Seattle’s and about 29% of Bellevue’s. For buyers who feel stretched in the Puget Sound market, that lower entry point can create options that may not feel realistic closer to the city.
The affordability gap goes beyond list prices. Census QuickFacts shows median monthly owner costs with a mortgage at $1,694 in Quincy, compared with $3,505 in Seattle and more than $4,000 in Bellevue.
On an income-to-housing-cost basis, Quincy also looks lighter. Mortgage-holding owner costs equal about 23% of median household income in Quincy, versus about 34% in Seattle and at least 29% in Bellevue. That does not guarantee affordability for every household, but it does help explain why buyers priced out of Seattle often look farther afield.
Monthly payment math often matters more than headline price. Using Realtor.com median listing prices and Freddie Mac’s 30-year fixed mortgage rate of 6.37% as of April 9, 2026, a buyer putting 20% down would have an estimated principal-and-interest payment of about:
These are principal-and-interest estimates only. They do not include taxes, insurance, HOA dues, or maintenance, but they still offer a useful side-by-side view of how dramatically the monthly cost picture can change.
Price is only one part of the story. The market tempo in Quincy is also very different from what you may be used to in Seattle.
Realtor.com shows Quincy with 116 homes for sale, 135 median days on market, and a 97% sale-to-list ratio. By comparison, Seattle has 2,771 homes for sale, 31 median days on market, and a 100% sale-to-list ratio, while Bellevue has 479 homes for sale, 29 median days on market, and a 99% sale-to-list ratio.
That means Quincy is moving more slowly, but it also has a much smaller inventory pool. You may have more room to negotiate than in Seattle, yet you may also need patience because there are simply fewer homes to choose from.
One of the most important differences is market leverage. Realtor.com labels Quincy a buyer’s market, while Seattle is labeled a seller’s market and Bellevue a balanced market.
In practical terms, Quincy homes sold for about 2.53% below asking on average, compared with roughly at asking in Seattle and 1.33% below asking in Bellevue. For you as a buyer, that can mean more flexibility around price, contingencies, or repair discussions, depending on the property and competition.
Quincy is not automatically the right move for every Seattle-area buyer. But based on the market data, a few buyer profiles stand out.
If your main goal is to lower your acquisition cost, Quincy offers a much lower median listing price than Seattle or Bellevue. The slower pace may also feel less intense than a fast-moving urban market.
That said, the smaller inventory base means you may need to stay flexible on timing. With only 116 homes for sale, the right fit may take longer to appear.
If you already own in Seattle or on the Eastside, Quincy may look attractive because the pricing gap is so wide. Moving from a market with a higher home value into a lower-cost market can open up different financial possibilities.
You may be able to reduce your monthly payment, preserve more liquidity, or buy with less financial strain. This is where finance-informed planning becomes especially important, because your equity, financing structure, and timing all shape the outcome.
For buyers who focus on rent coverage, Quincy may pencil out better on paper. Based on the current figures in the research, a rough gross-rent screen is about 5.2% in Quincy, compared with 4.3% in Seattle and 2.4% in Bellevue.
That is not a full underwriting model, and it should not replace property-level analysis. But it does suggest that Quincy may deserve a closer look if rental income is part of your evaluation.
Lower acquisition cost is part of Quincy’s appeal for second-home shoppers. If you are comparing that option with Seattle or Bellevue pricing, Quincy can look far more approachable.
The tradeoff is selection. Realtor.com reports just 116 homes for sale and 11 rentals, so your options are much thinner than in larger metro markets.
A lower sticker price does not mean you should move fast without a plan. Cross-market purchases usually work best when you evaluate the numbers and the process together.
Here are a few areas to pay close attention to:
When you are comparing Quincy with Seattle or Bellevue, the biggest risk is oversimplifying the choice. A lower list price is helpful, but the better question is whether the purchase supports your broader goals.
That is where strong financial guidance can make a real difference. Looking at payment structure, cash reserves, offer terms, and long-term flexibility can help you avoid buying based on price alone.
For Seattle-area buyers who want a lower price point and a different market dynamic, Quincy deserves a serious look. The current data shows lower median prices, lower estimated monthly principal-and-interest payments, and more buyer-friendly conditions than Seattle or Bellevue.
At the same time, Quincy is a smaller and more selective market. If you are considering a move, second home, or investment purchase there, you will want a strategy that matches the market you are entering. If you want help comparing your options and building a clear plan, connect with The Rachel Olson Group for thoughtful, finance-informed guidance.

August 27, 2026

August 20, 2026

August 13, 2026

August 6, 2026

August 6, 2026
July 23, 2026
July 16, 2026
July 9, 2026
July 2, 2026
June 25, 2026
June 18, 2026
June 11, 2026
June 4, 2026
May 28, 2026
May 21, 2026

May 14, 2026

May 7, 2026

April 23, 2026
April 16, 2026
April 2, 2026
first time home buyer
Rachel Olson | March 24, 2026
A Guide for First-Time Homebuyers in 2026
March 24, 2026
March 5, 2026
February 19, 2026

February 5, 2026
January 15, 2026
January 1, 2026

December 18, 2025

December 4, 2025

November 21, 2025
The Rachel Olson Group is comprised of a team of local real estate professionals committed to selling some of the most desired homes in Greater Seattle. We are committed to providing top-notch service for our clients and helping them navigate what can be a tough Seattle market. Please contact us today to get a no-obligation analysis of your home value or to take a tour of a potential new home!